The GDB Python API, ARM, RISC-V, Low Level Debugging
A Memory View Tui Window For Gdb
21 Oct 2024 – StevenLwczIntroduction
Creating a memory view for GDB using the GDB Python API.
In this post we will turn the mv.py developed in the previous post to display the memory view in a TUI window. As normal, we will build on the framework we have developed in previous posts.
Creating the Memory View
Memory addresses may not be valid. The process has stopped running or the address is out of the memory range allowed by the process, either from user input or by scrolling through the memory. In these cases read_memory() throws a gdb.MemoryView exception which we can catch.
The first thing to write is set_display() which takes an address to read and display. Here is the same code we created in the previous post using slices in to the MemoryView object.
The return will keep the current display on the TUI window in the case of the MemoryError exception.
class MemView(object):

    def set_display(self, addr):
        n = self.tui.height * VIEWLINELEN
        try:
            mv = gdb.selected_inferior().read_memory(addr, n)
        except gdb.MemoryError:
            return

        self.addr = addr
        self.buff = ""
        for i in range(0, n, VIEWLINELEN):
            m = mv[i:i + VIEWLINELEN]
            text = pattern.sub('.', m.tobytes().decode('latin-1'))
            self.buff+=f"{GREEN}{hex(addr + i)}: {BLUE}{m.hex(' ')}{RESET} {text}\n"

        self.render()
In this version of GDB 13.1 I’m now able to write the entire buffer to the TUI using the True paramter of write().
    def render(self):
        if not self.tui.is_valid():
            return

        self.tui.write(self.buff, True)
Memview layout
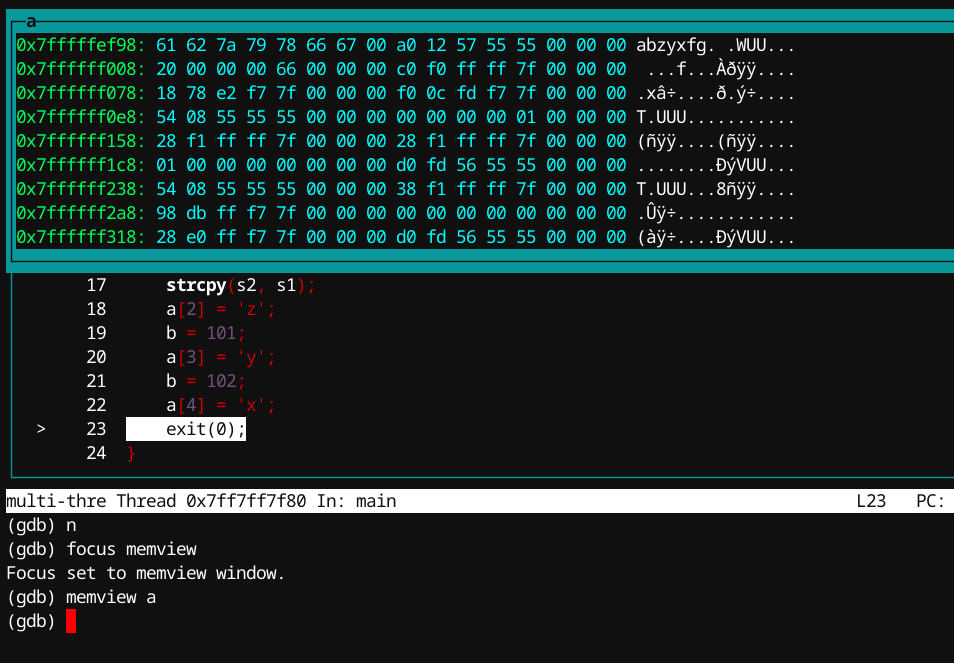
The a-gdb.gdb defines a new layout memview which can be switched to using (gdb) layout memview.
tui new-layout memview memview 1 src 1 status 0 cmd 1
GDB User Defined Command memview
Here we will create a GDB user command called memview which will take an expression just like (gdb) x.
The expression can be a variable, address, register or exprsssion. If it is a variable we will find its address else just use the expression as the address.
Assuming that you don’t want the top third of GDB taken up by a blank window if you are not interested in a memory view right now, it will try its best to detect if the memview layout is not active and use gdb.execute("layout memview") to switch into it.
class MemViewCmd(gdb.Command):

    def invoke(self, arguments, from_tty):
        if gdb.selected_inferior().pid == 0:
            print("memview: no program running")
            return

        if len(arguments) == 0:
            print("memview: expression")
            return

        try:
            expr = gdb.parse_and_eval(arguments)
        except gdb.error:
            print("memview: can't evaluate {arguments}")
            return

        addr = expr.address if expr.address != None else expr

        if self.win == None:
            gdb.execute("layout memview")

        if not self.win.tui.is_valid():
            gdb.execute("layout memview")

        n = self.win.tui.height * VIEWLINELEN
        try:
            mv = gdb.selected_inferior().read_memory(addr, n)
        except gdb.MemoryError:
            print(f"memview: can't read memory at {hex(addr)}")
            return

        self.win.set_title(arguments)
        self.win.set_display(addr)
You can use (gdb) layout src or (gdb) tui disable to switch back to your previous view.
Vertical Scrolling
This will allow us to explore the memory around the initial view and explore the whole region of the current memory block.
    def vscroll(self, num):
        addr = self.addr + num * VIEWLINELEN
        self.set_display(addr)
To get focus of the view and use the up and down arrow keys to scroll (gdb) focus memview. Scrolling will stop if you scroll beyond the valid range of the memory block.
Auto Update of the Memory View
As you debug through the program and change the item you have selected to view the memory of, it would be handy to see the changes in the memory view. We can use GBB event handling to auto update the view after each GDB command.
Here we register auto_view() to be called after each command. It will just cause the memory to be re-read and displayed in the TUI window.
connect() allows multiple functions to be called on the event. To stop auto_view{} being repeatedly added to the chain (which could cause problems), we protect with the variable auto.
If no events have been registered then disconnect() throws SystemError, which will mess up the debug session. We just catch and ignore.
There are many ways you can swich layouts, end processes and so on. This simple approach will keep the GDB debug session stable.
        if not self.win.auto:
            gdb.events.before_prompt.connect(self.win.auto_view)
            self.win.auto = True

    def auto_view(self):
        self.set_display(self.addr)

    def close(self):
        try:
            gdb.events.before_prompt.disconnect(self.auto_view)
            self.auto = False
        except SystemError as e:
            pass
Now as you step through the program and the memory changes, it will get updated. One handy feature might be to colourise any changes. One for a future post no doubt.
Conclusion
We have turned the initial POC mv.py using the read_memory() API into another little tool we can use to help debug our applications in GDB in a more friendly way.
My github repository has the full code and demo.
$ gdb -q -a a.c
$ gdb -q a
(gdb) r
(gdb) layout memview
(gdb) memview a

In the next post we will use our memview program to do some ‘fun things’ which will help us understand the memory layout of our running process.